What to make of January’s returns?

Unless you are widely read in finance, it’s unlikely you will have heard of the "January effect."
The January effect was noted by an investment banker named Sidney Wachtel in the 1940’s and he published a paper in the Journal of Business entitled, "Certain Observations on Seasonal Movements in Stock Prices.”
In the paper, Wachtel observed what appeared to be a consistent seasonal pattern in share market returns. According to his observations, share markets rallied each January. In fact, January often had the best returns of any month of the year.
What’s more, after looking at results from subsequent years, the pattern seemed to hold up. It was such a phenomenon that people started grasping for answers as to why. Suggestions abounded. With the US tax year ending in December, was it money going back into the market from investors that sold in December for tax purposes? Others suggested it was due to underlying emotional or psychological reasons, such as a New Year’s resolution to invest in the sharemarket and therefore an influx of money was invested in January as a result. Economic professors even conducted lab experiments to determine if they could replicate the issue in simulated markets operated by students.(1)
Things went from strange to bizarre. As investors became aware of the January effect, they started anticipating it. They would buy up at the end of the year, thinking they could get in ahead of the crowd. This became known as…. and we’re not joking here… “The Santa Claus Rally.”
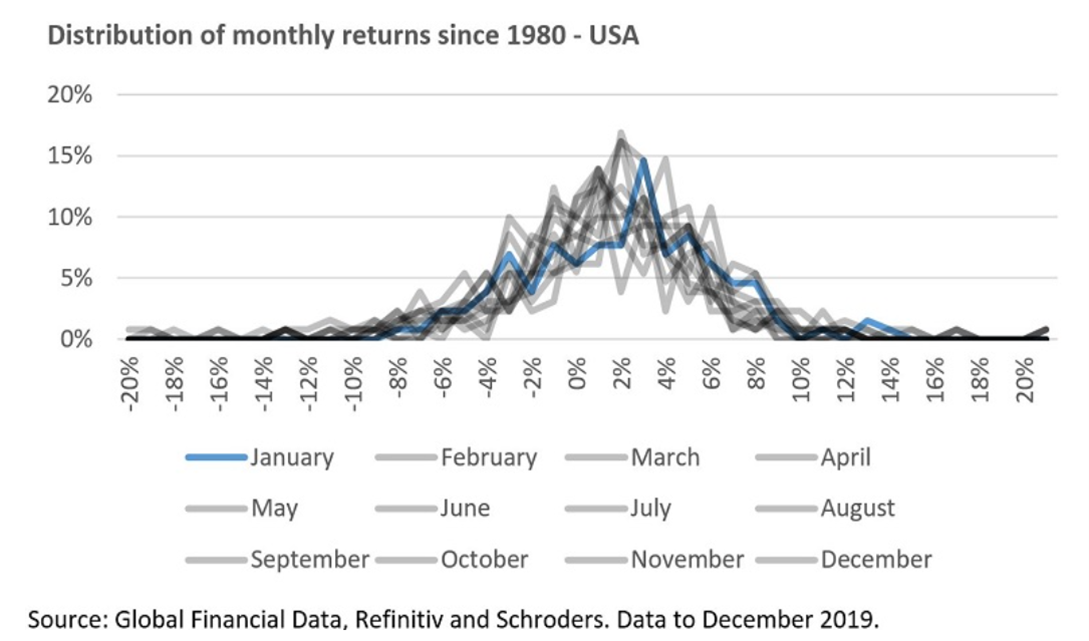
For all that, since 1980 clear evidence of a January effect is difficult to find as the chart below from Schroeder’s and Refinitiv highlights.
To understand if this was a global phenomenon, Mahendra Raj and David Thurston studied the issue in a New Zealand context. In an article titled, “January or April? Tests of the turn–of–the–year effect in the New Zealand stock market,” published in Applied Economics Letters, the authors postulated that if the January effect was due to taxes, it should show up in New Zealand in line with the new financial year, April. What is unclear is whether Raj and Thurston considered that New Zealand’s lack of a capital gains tax makes locking in a tax loss at the end of a financial year, a bit of a non-issue.
However, their conclusion was, “The study finds that there is neither a January effect nor an April effect in New Zealand.”
Another paper, published in 2010, pointed out that the worst returns in New Zealand are typically in August.
August? Why?
The authors’ assessment was “probably due to the fact that August is the bitterest and rainiest month of the year in New Zealand.”(2) In other words, they had no idea why. More pertinently, the authors concluded there were “no typical seasonal anomalies” in January or April in New Zealand.
So why bring up this strange artefact of share market history? It’s certainly not because we think this is a profitable trading strategy. We think it illustrates the issue of looking too closely at one month or even a pattern of returns.
Markets in January 2022 were disappointing with the main NZX 50 Index falling almost 9%. It’s understandable that people are looking at this performance, and perhaps you are too. But if there was such a thing as the January effect that predicted positive monthly returns, then 2022 was clearly a year that broke the pattern. Perhaps because there never was a pattern, no matter how the data over certain time periods may have looked. We’d certainly hate to think any investors were banking on the January effect in 2022.
So why did markets decline? There are a few reasons, but the most important is that central banks, especially the United States Federal Reserve, have suggested that in response to inflation, they will be increasing interest rates this year. This makes borrowing more expensive, which makes money-making ventures based on borrowing less profitable overall. Everyone understands that, and those Kiwis whose mortgages come up for renewal in 2022 will really understand it.
Ben Carlson(3) recently shared in his blog that most years in the United States (59 out of 94 to be precise) there was some point during the year where markets lost 10%.
That’s worth emphasising. In MOST years, markets are down by 10% at some point in the year. Carlson also found that in the majority of those years, markets finished positive.
So, what can you learn from one month of data? We’d suggest not a lot. Unlike the pattern seekers that coined the January effect or the Santa Claus Rally, our advice is consistent and built for the long term. Our plans are resilient to fluctuations whatever month they arrive in… even August. Clients with a short term need for spending should have defensive assets in their portfolio. For those with long term spending needs, one month of data, whether going up or down, is not something to focus on.
Unlike in the United States, January is our month for family, sun and holidays. Now that really does sound like a pattern worth investing in.
- Anderson, Lisa, Gerlach, Jeffrey and DiTraglia, Francis, (2005), Yes, Wall Street, There Is a January Effect! Evidence from Laboratory Auctions, No 15, Working Papers, Department of Economics, College of William and Mary.
- https://www.semanticscholar.org/paper/Monthly-Seasonality-in-the-New-Zealand-Stock-Market-Li-Liu/6e3454ca4c3250e33f09bf9d90ce81bb9dd1bc7e
- https://awealthofcommonsense.com/2022/01/this-is-normal